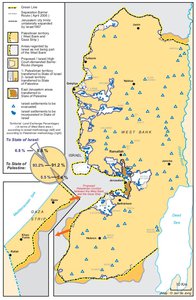
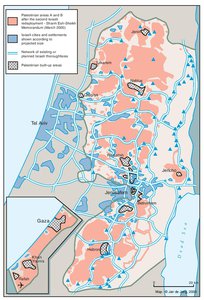
WEST BANK AND GAZA STRIP, MARCH 2000
Map Details
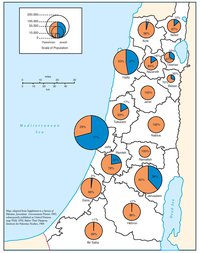
The Palestinian Central Bureau of Statistics (PCBS) conducted its first census of the OPT in 1997. The total
population of 2,895,683 was then made up of 1,873,476 Palestinians in the West Bank and 1,022,027 in the
Gaza Strip. Projections based on a 3.7% annual growth rate in the West Bank and one of 4.1% in the Gaza
Strip put the 2000 population at a minimum of 3,242,385 - 36% living in the Gaza Strip and 64% in the West
Bank. The high growth rate, more than three times that of the Jewish population in Israel, was reflected in
the 47% of OPT Palestinians aged 0-14 in 2000. Some 1.3 million Palestinians (40% of the OPT total) were
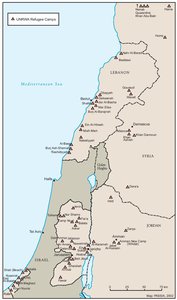
residing in the 16 major urban centers, 609,000 registered refugees (19%) remained in the 27 OPT UNRWA
camps, and the remaining 1.34 million resided in ca. 800 rural townships, villages and hamlets. The largest
city, Gaza, with a population of 343,904, dwarfed all other urban centers, only four of which counted over
100,000 inhabitants: Jerusalem – approx. 235,041; Hebron - 140,055; Nablus - 115,872; and Khan Younis -
105,095.
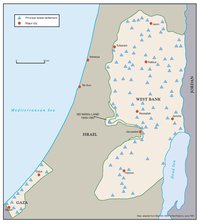
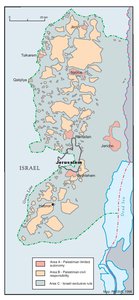
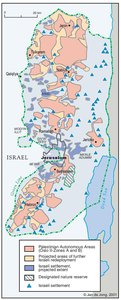
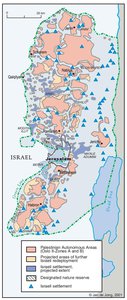
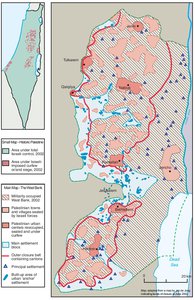
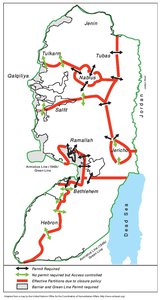
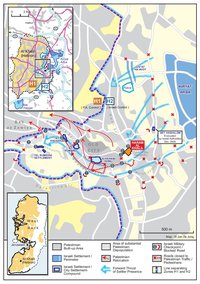
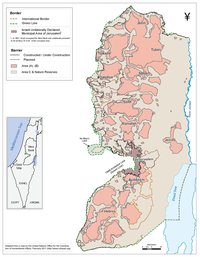
Israeli redeployments implemented by March 2000 placed roughly 430,000 West Bank urban residents in
Area A, under PA rule, but left the remaining 1.7 million West Bank residents either under Palestinian administration
but Israeli security (Area B) or exclusive Israeli (Area C) control. Meanwhile, outside the OPT,
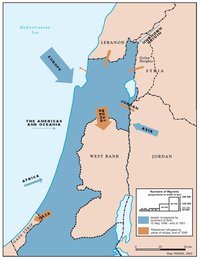
the Palestinian Diaspora population had reached nearly 4.5 million and the number of Palestinians living in
Israel totaled 1.09 million. These figures revealed the OPT population to be less than 50% of a global total
of 8.7 million Palestinians, and the worldwide refugee population to be fully two-thirds of the Palestinian
people.
An estimated 97% of all OPT Palestinians in 2000 were Sunni Muslims, with the small Christian minority
concentrated in Bethlehem (and surrounds), Jerusalem and Ramallah, as well as in some nine West Bank
villages. Over half of the Christian community were Greek Orthodox, though at least eight other denominations
were represented.
The Palestinian economy in the post-Oslo I (1994) period had fluctuated dramatically as a result of Israel’s
closure policy. The failure of the PA to foster independent socio-economic structures and the poor
performance of its main ministries contributed to a dismal GDP growth rate and increasing poverty levels.
The economic protocols accompanying the Oslo agreements had increased Palestinian dependence on
Israel, creating an economy heavily reliant on exports to or via Israel. Some 80% of the OPT’s GDP relied
on exports - 80% of these to Israel, while of trade within the OPT 58% was reliant on imported goods -
again from or via Israel. This ‘arrangement’ left the PA relying on Israeli customs authorities for VAT
reimbursements making up 63% of its annual revenue.
In 2000, the World Bank estimated per-capita GDP to have fallen 10% on 1999 levels and reported that
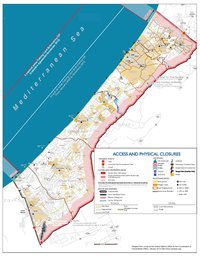
more than one in five Palestinians was living below the $2-a-day poverty line. The situation was worst in
Gaza, where closures forced 30% of households to use family savings and sell jewelry to subsist. Enforced
separation between the West Bank and Gaza had brought about a 50% decline since 1994 in the number of
Gaza students studying in West Bank universities and by 2000, nearly 6% of 10-17 year-old OPT children
had entered the labor force.
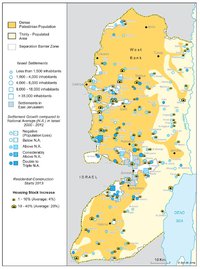
The promised economic benefits of the Oslo process had thus far been nearly completely one-sided, with
Israel controlling a captive market and production force, as well as developing its economic normalization
with regional Arab trading partners. During the same, extended interim period, Israel had achieved a 52.5%
increase in settlement housing (excluding East Jerusalem), a near 100% increase in the number of settlers,
and the establishment of at least 35 new settlement sites. Meanwhile, during the period 1994-2000, Israel
demolished 887 Palestinian homes in the OPT. The Israeli budget for the year 2000 allocated NIS 120
million for additional settlement expansion, NIS 216 million for OPT ‘land acquisition’ and NIS 27 million for
further bypass road construction.
Related Maps
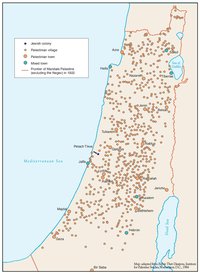
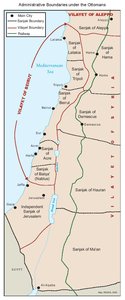
OTTOMAN PALESTINE, 1878
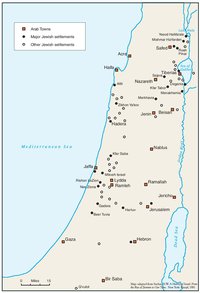
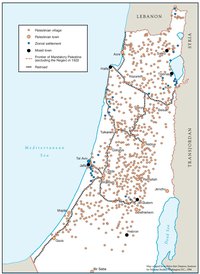
ARAB TOWNS AND JEWISH SETTLEMENTS IN PALESTINE, 1881-1914
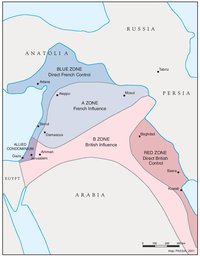
THE SYKES-PICOT AGREEMENT, 1916
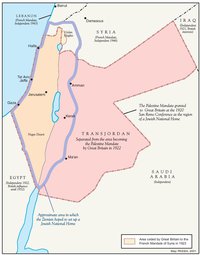
THE BEGINNING OF THE BRITISH MANDATE, 1920
PALESTINE UNDER THE BRITISH MANDATE
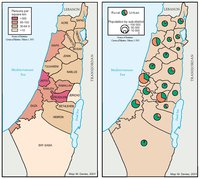
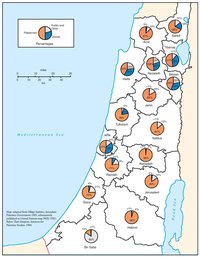
THE DEMOGRAPHY OF PALESTINE, 1931
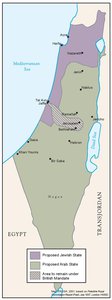
THE PEEL COMMISSION PARTITION PROPOSAL, 1937
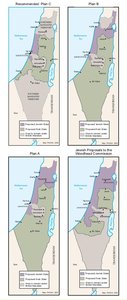
THE WOODHEAD COMMISSION PARTITION PROPOSALS, 1938
PALESTINIAN AND ZIONIST LANDOWNERSHIP BY SUB-DISTRICT, 1945
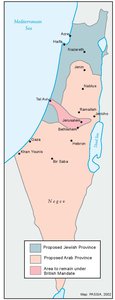
THE MORRISON-GRADY PARTITIONED TRUSTEESHIP PLAN, 1946
POPULATION OF PALESTINE BY SUB-DISTRICT, 1946
LAND OWNERSHIP IN PALESTINE, 1948
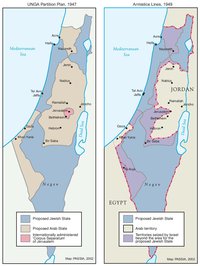
THE UNGA PARTITION PLAN, 1947 – THE 1948 WAR & THE 1949 ARMISTICE LINES
POPULATION MOVEMENTS, 1948-1951
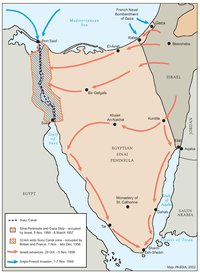
THE SUEZ WAR, 1956
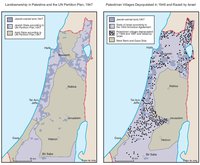
LAND OWNERSHIP IN PALESTINE AND THE UN PARTITION PLAN - PALESTINIAN DEPOPULATED AND DESTROYED VILLAGES, 1948-1949
THE PALESTINIAN DIASPORA, 1958
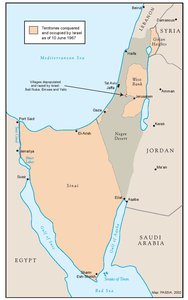
THE NEAR EAST AFTER THE JUNE 1967 WAR
THE ALLON PLAN, JUNE 1967
THE OCTOBER WAR, 1973
THE PALESTINIANS INSIDE ISRAEL, 1977
THE CAMP DAVID ACCORDS, 1978-1979
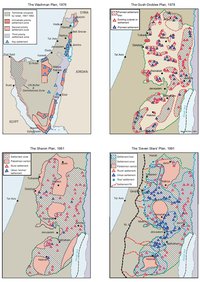
ISRAELI SETTLEMENT MASTER PLANS, 1976-1991
THE 1991 MADRID PEACE CONFERENCE & ISRAELI SETTLEMENTS
GAZA-JERICHO (OSLO I) AGREEMENT, CAIRO, 4 MAY 1994
INTERIM (OSLO II) AGREEMENT, TABA, 28 SEPTEMBER 1995
HEBRON PROTOCOL, 15 JANUARY 1997
WYE RIVER MEMORANDUM, 23 OCTOBER 1998
SHARM ESH-SHEIKH AGREEMENT, 4 SEPTEMBER 1999
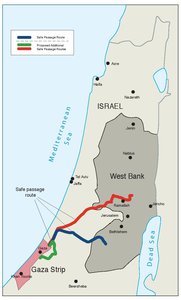
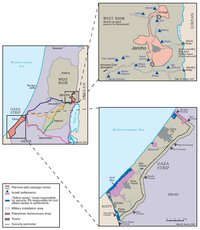
PROTOCOL CONCERNING SAFE PASSAGE BETWEEN THE WEST BANK AND THE GAZA STRIP, 5 OCTOBER 1999
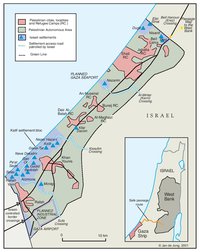
GAZA, 2000
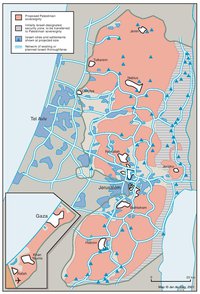
CAMP DAVID PROJECTION, JULY 2000
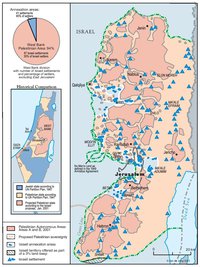
TABA TALKS PROJECTION, JANUARY 2001
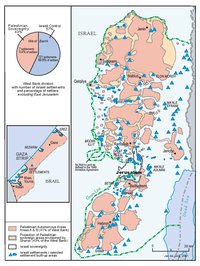
THE SHARON PROPOSAL, SPRING 2001
THE REINVASION OF THE PALESTINIAN TERRITORIES, 2001-2002
THE ROAD MAP, 2003
THE GENEVA INITIATIVE AND ACCORD, 2003
THE ISRAELI DISENGAGEMENT PLAN, 2003-2005
AGREED DOCUMENTS ON MOVEMENT AND ACCESS FROM AND TO GAZA, 2005

THE SETTLERS' PLAN FOR PALESTINIAN AUTONOMY, 2006
THE GAZA STRIP TODAY (2014)
THE WEST BANK TODAY (2014)
ADMINISTRATIVE BOUNDARIES
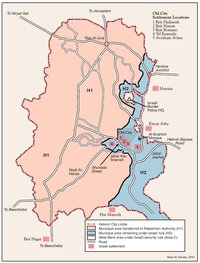
HEBRON
Area C